Introduction to Wireshark
Hello friend!
In the first 2 articles of this series(article1 & article2), we had a short intro on the Networking Stack. We saw that data is broken into smaller chunks, multiple headers are added(typically one by each layer) and sent over the network.
Everytime you browse something, requests are sent to the server in the form of packets. Some time later, a response is sent back in the form of packets. Each of these packets have headers of multiple protocols. It’ll be very interesting to go through the contents of these headers, understand what they are which will help us in understanding that particular protocol in general.
To go through the headers, we first need to catch hold of the packets. How do we do it?
Wireshark to the rescue!
1. Introduction
We know that every single packet in and out of the machine must go through the Network Interface Card(NIC). Wireshark will attach itself to the NIC and collect every single packet that comes to the NIC. A tool which sniffs for packets is called packet sniffer.
It collects the packets and it analyzes the headers itself and presents all the data in human readable form. This will help us understand what these headers have.
2. Downloading Wireshark
You can install Wireshark in the following manner.
- For Debian or it’s forks,
$ sudo apt-get install wireshark - For CentOS, RHEL, Fedora,
$ sudo yum install wireshark - For Windows, you can download it from here.
Now that you have Wireshark on your machine, let us do some basic stuff with it.
3. Basic Tutorial
a. Opening up Wireshark and capturing packets
- If you are working on a Linux system, open up a terminal. Run Wireshark as root.
$ sudo wireshark [sudo] password for adwi:- Note that Wireshark
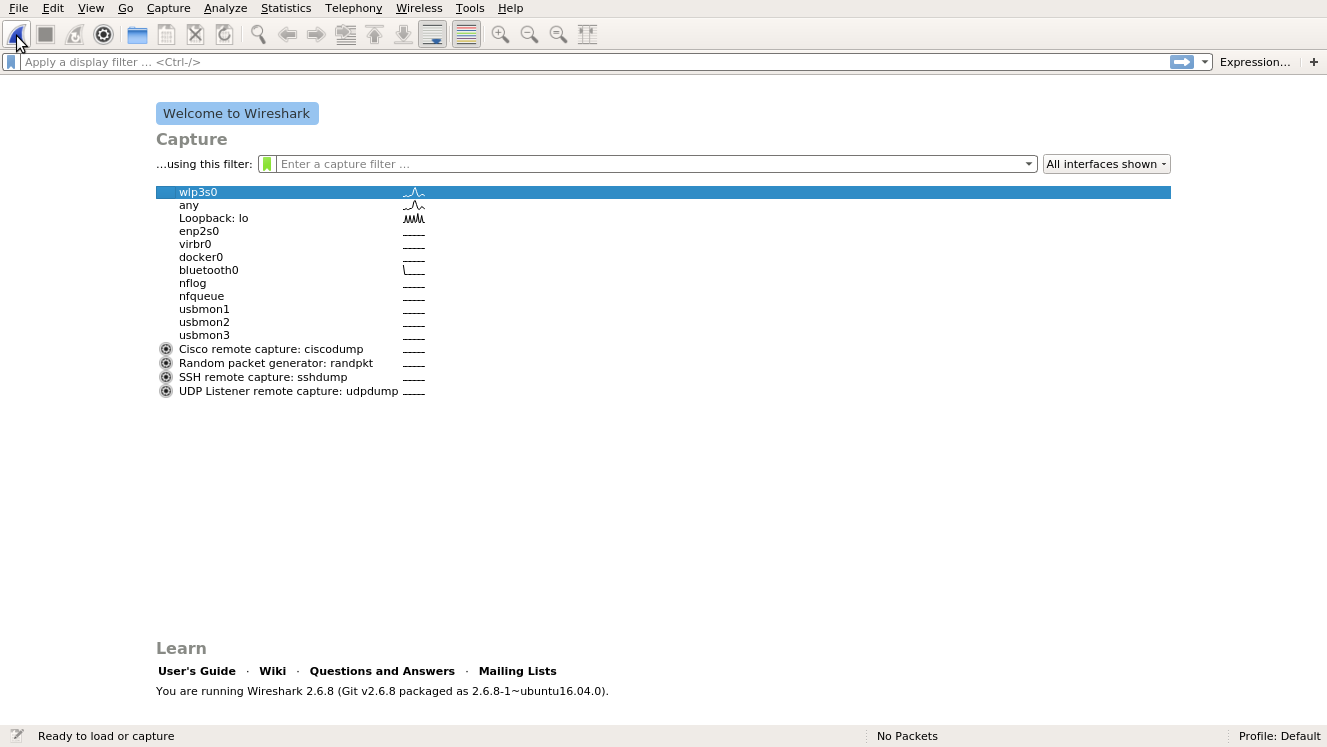
- You should be seeing a window like this.
 .
.
That is a list of interfaces from which we can capture packets. wlp3s0, lo, enp2s0 etc., are all various interfaces. wlp3s0 is my WiFi Adapter. enp2s0 is my ethernet card. lo is the loopback interface. You may or may not have the same names or the same number of interfaces.
Sometimes, WiFi adapter is identified by wlan0, Ethernet card by en0 or eth0.
Currently ignore the using this filter field. We’ll come to that later.
I’ll choose wlp3s0 because I am currently connected to the network through WiFi.
Corresponding to each interface, there is a graph kind of a thing. That denotes the amount of traffic at these interfaces. Generally, the interface with with peaks, fluctuations is the interface which is active.
That blue button on top-left is the capture button. Let us choose the right interface and start capturing.
Just after you start capturing, you’ll see packets overflowing :P
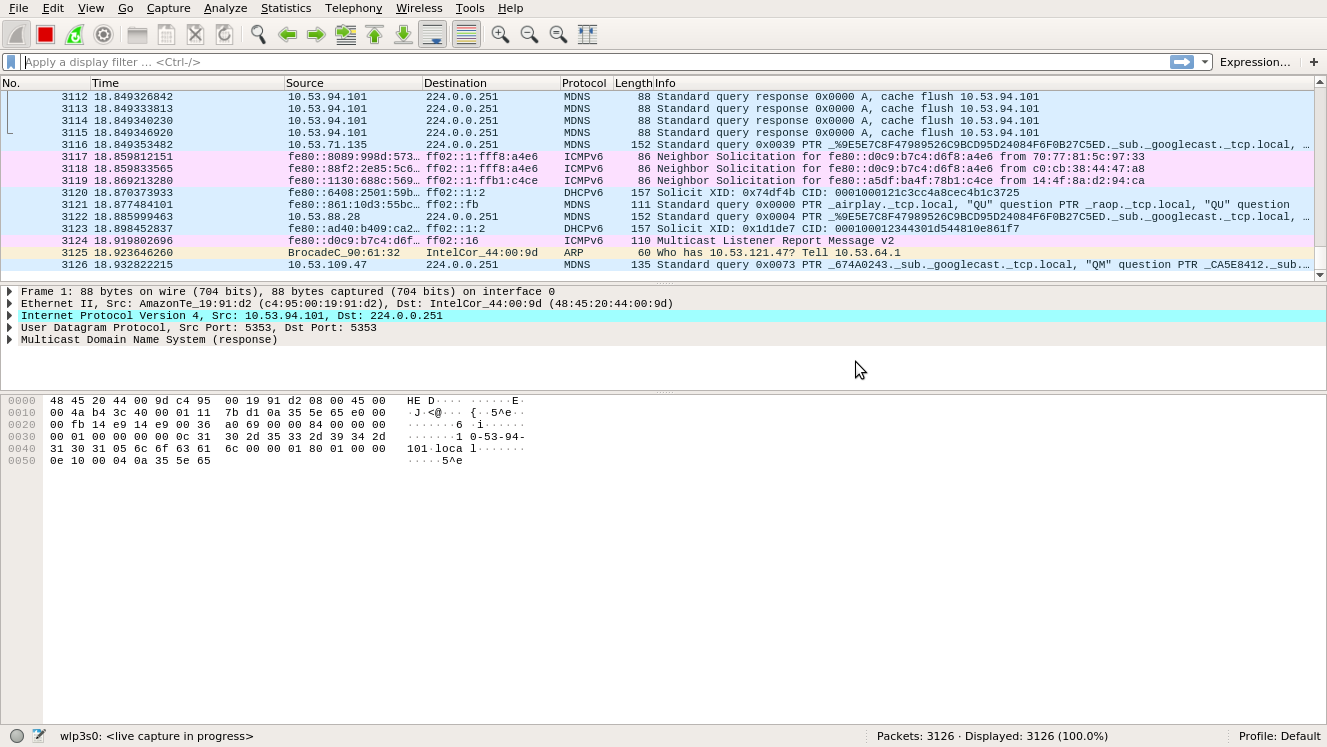
The red-top-left button is the stop-capture button.
b. Inspecting a packet
By this time, A lot of packets would have got collected. Stop the capture.
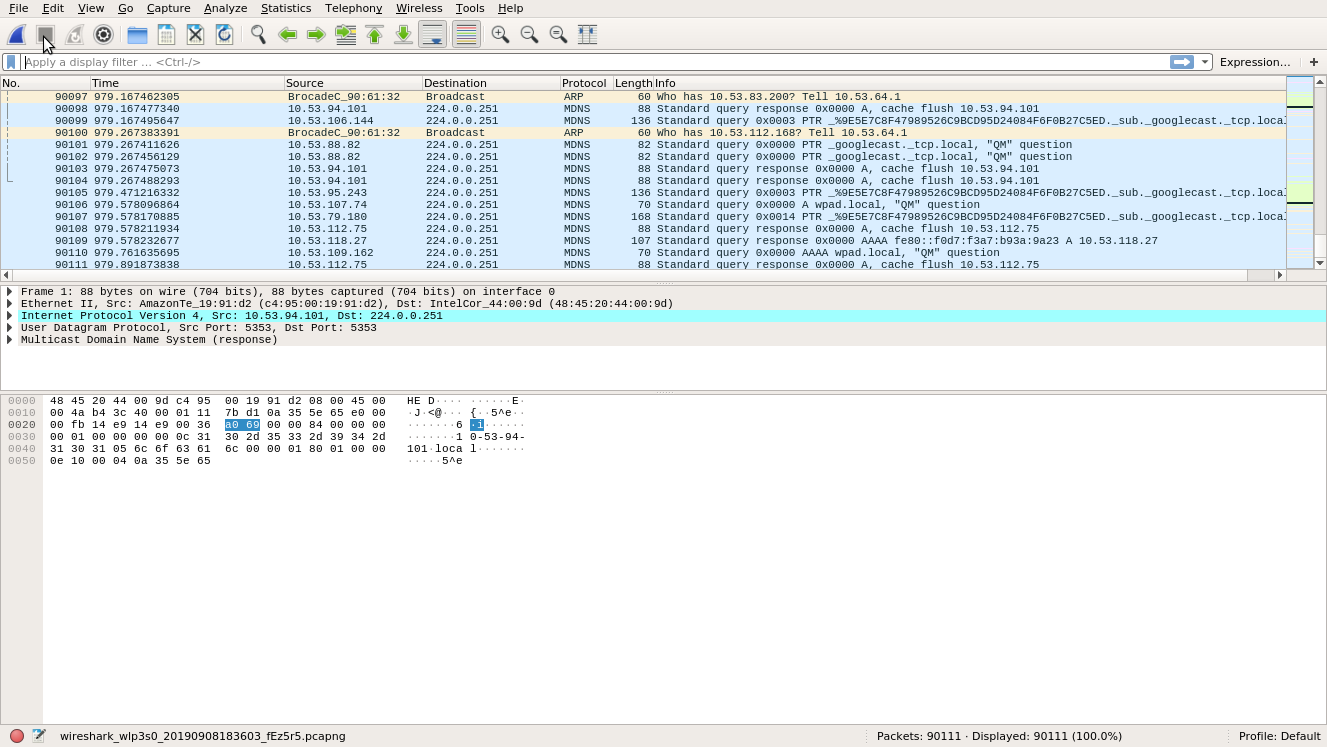
The complete window is divided into 3 parts:
- List of packets
- Information about a chosen packet after processing it
- Contents of the packet - just an array of bytes
Go ahead and choose a packet.
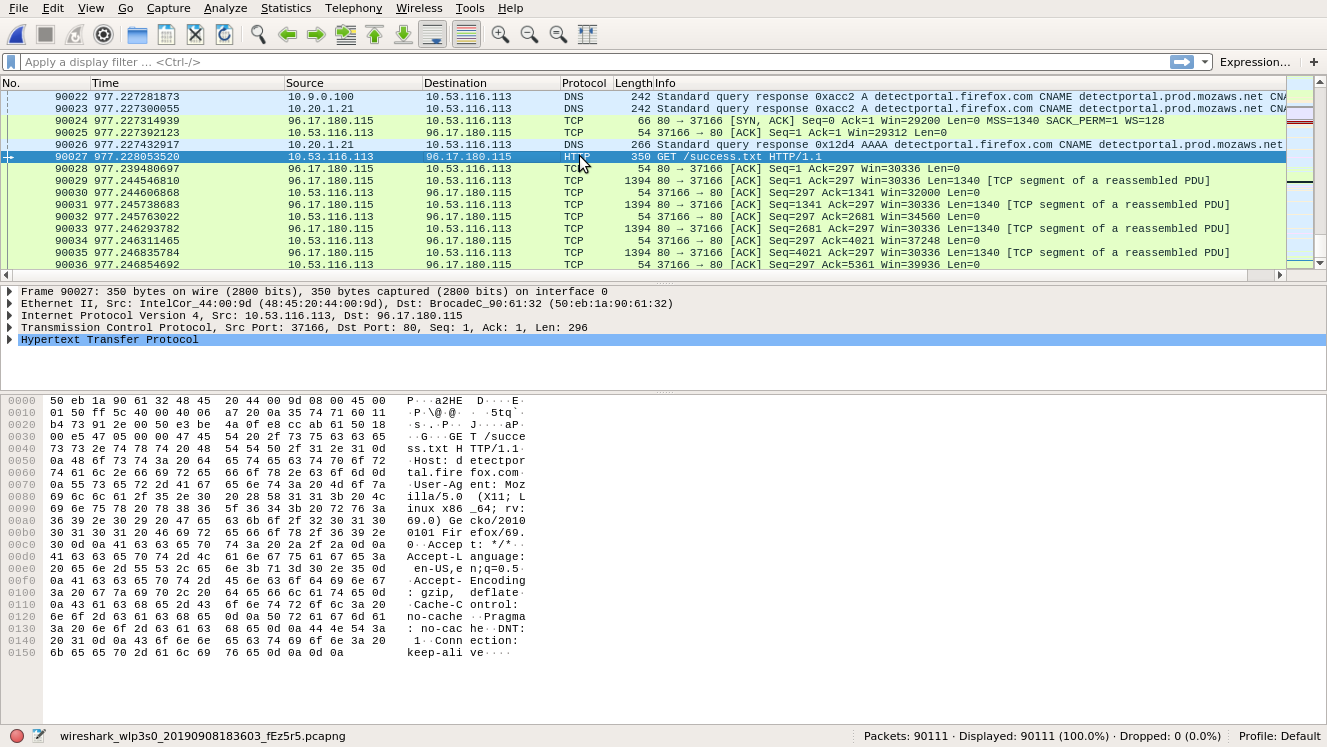
Look at the above screenshot.
Let us look at the first window. It has a lot of info.
- Packet number
- Timestamp
- Source IP Address
- Destination IP Address
- Highest-layer protocol
- Length of the packet
- Some important info about the packet
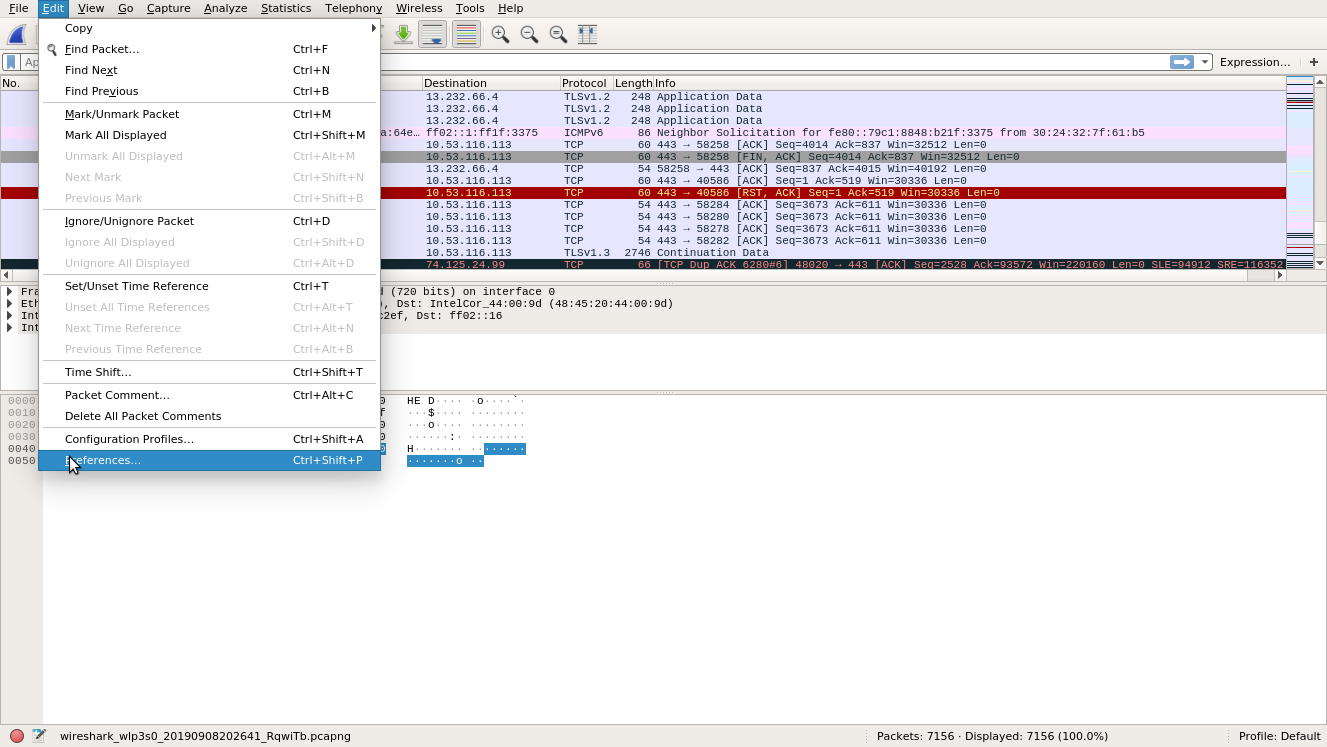
These are the default columns. You can add or delete columns. Suppose you want a column which will show Source and Destination MAC Addresses, you can do that in the following manner.
-
Go to Edit -> Preferences.
-
A window opens up with a bunch of stuff.
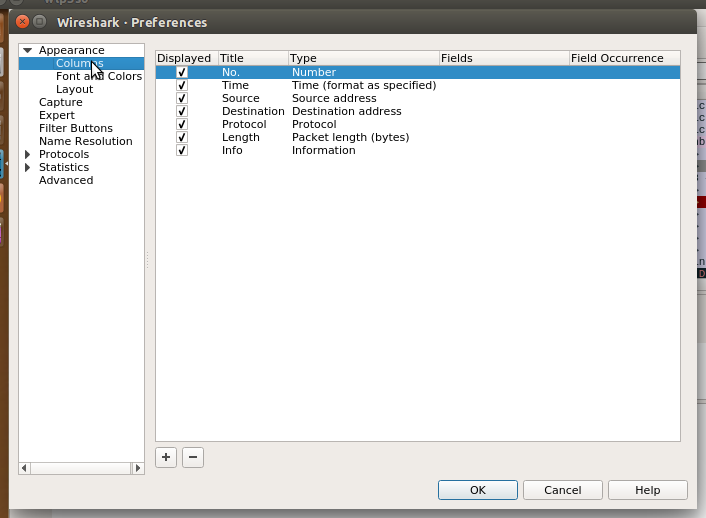
- Our focus is on the Columns. The default Column names are listed there. We need to add one more. That is easy.
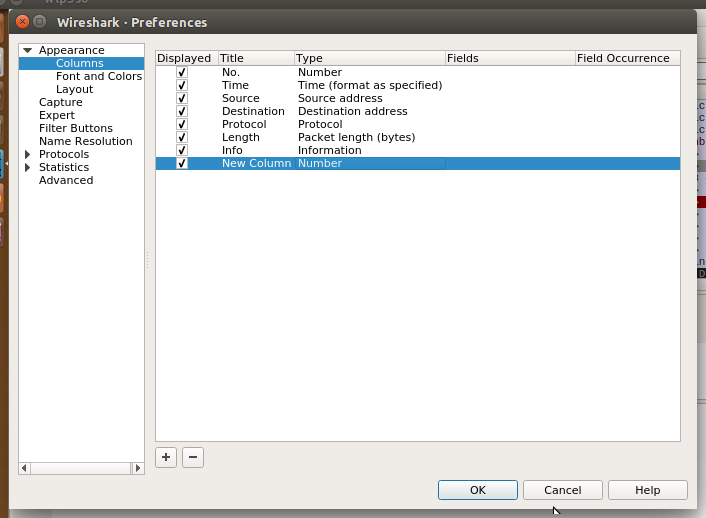
- Add the appropriate Title and Type. It looks like this.
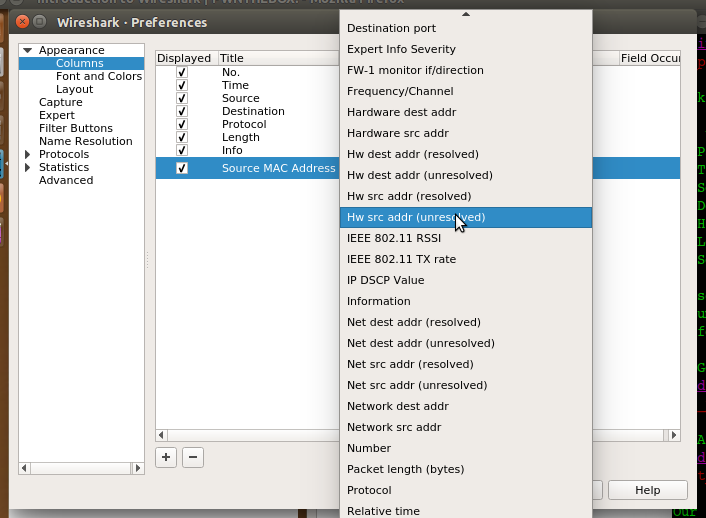
- In this case, I added the Source MAC Address or the Hardware(Hw) src addr. Let us apply this and go back if the new column appears or not. Wireshark’s main window looks like this now.
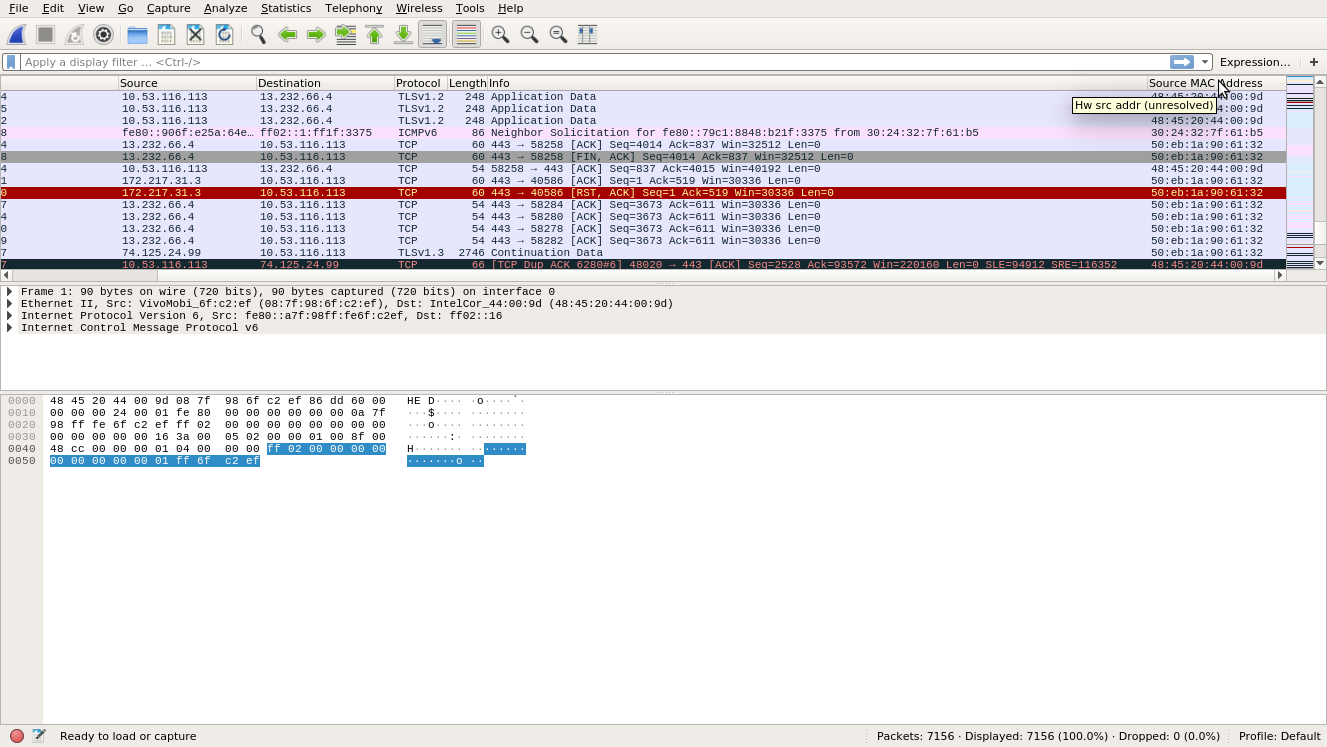
- So it has come up!
b. Inspecting a single packet
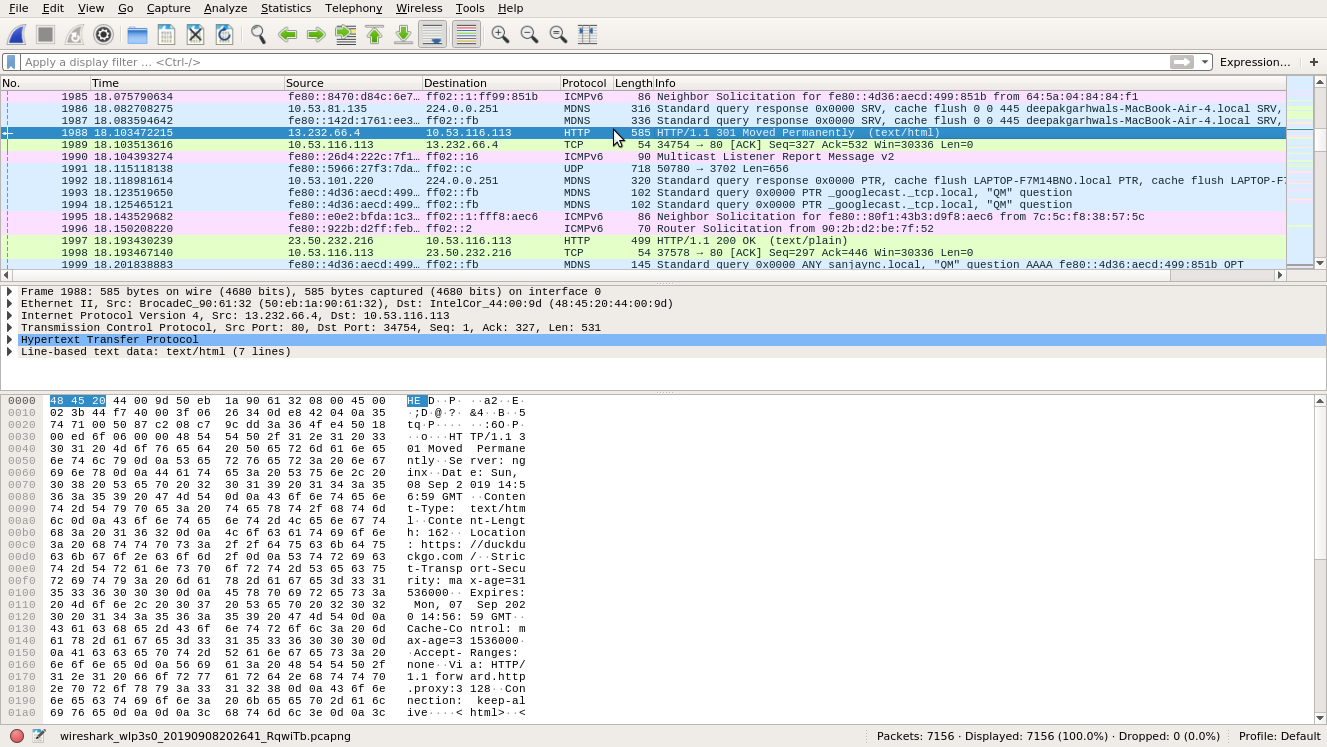
We saw that Wireshark’s window space is divided into 3 parts. Go ahead and pick a packet of your choice from the first part.
-
What you see in the second part is the chosen packet’s information - starting from Layer 2 information like Ethernet addresses to topmost-layer information. Wireshark has processed the packet and dumped it in human-readable form.
-
The third part contains the content of the packet in raw-bytes.
You can go through each one of the sections in part-2, explore! . This exploration is the rest of the series - exploring various protocols of different layers, understanding their header contents, what they tell about the protocol and more!
c. Storing the captured packets
Once we have captured a bunch of packets, we’d like to store it in a file. It’ll help if we want to analyze it later.
- You can go to File -> Save As and save the file with whatever name you want.
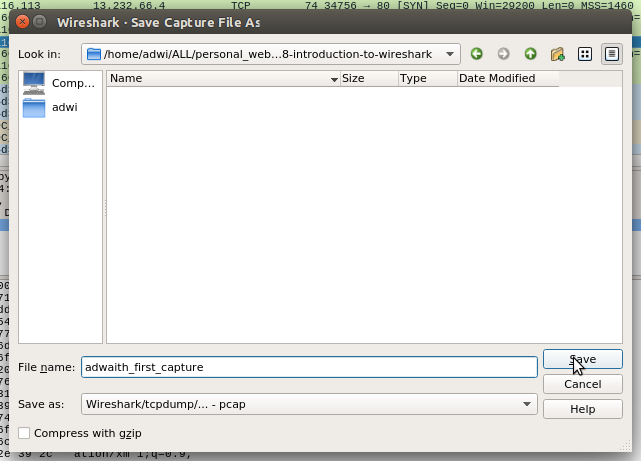
With that, you’ll have all the captured packets in one file. But how would you analyze it later?
d. Opening a pcap file in Wireshark
- It is similar to opening a file in any application. Goto File -> Open and choose the pcap file you want.
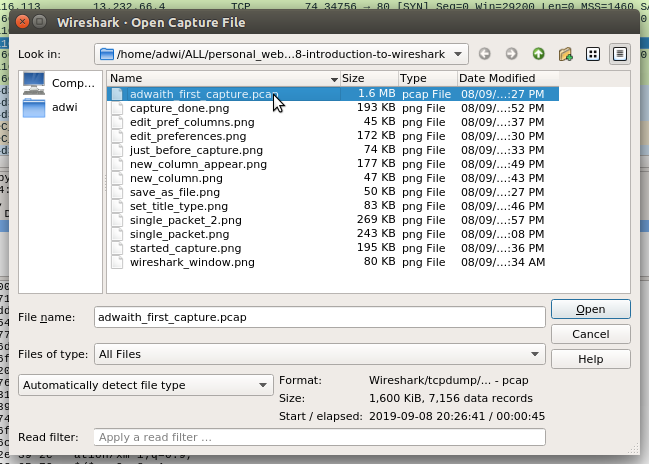
You can download my pcap file from here.
This was a super simplified tutorial on Wireshark. This was an attempt to give a glimpse of what Wireshark is capable of. Wireshark is jam-packed with features. As we move forward with the series, we’ll learn and use new features.
I urge you to explore more features!
This is Wireshark’s User Guide: Section 3, 4 and 5 are most relevant.
With this article, we are familiar with our second pre-requisite(listed here). We are left with third and final pre-requisite - knowing what an RFC is. We’ll delve into it in the next article.
That is it for now.
Thank you for reading and happy networking :)